

Most Amazon sellers vet products by drowning in twenty different metrics. They only need three.
The sellers who survive past their first inventory order all check the same three numbers before they put money behind a product. The sellers who get burned almost always missed at least one of the three.
This is not the entire product research workflow. There are a hundred other things to look at if you want to. But if any one of these three numbers fails, you pass. No matter what the rest of the data says. That's the whole framework.
Number 1: Real BSR, not snapshot BSR
When you pull up an Amazon listing and you see a Best Sellers Rank of 4,000 in Home and Kitchen, that number is a snapshot. It's where the product ranked at that exact second. That's all.
That number tells you nothing about whether the product actually sells consistently. It tells you nothing about whether the product is trending up, trending down, or about to fall off a cliff.
What you actually want is the 90-day BSR trend. The average rank over the last three months, plus the shape of the line.
Flat and low is good. Spiky is okay if it's seasonal and the reason is obvious. A line that's been climbing for sixty straight days means the product is dying. The snapshot won't tell you that.
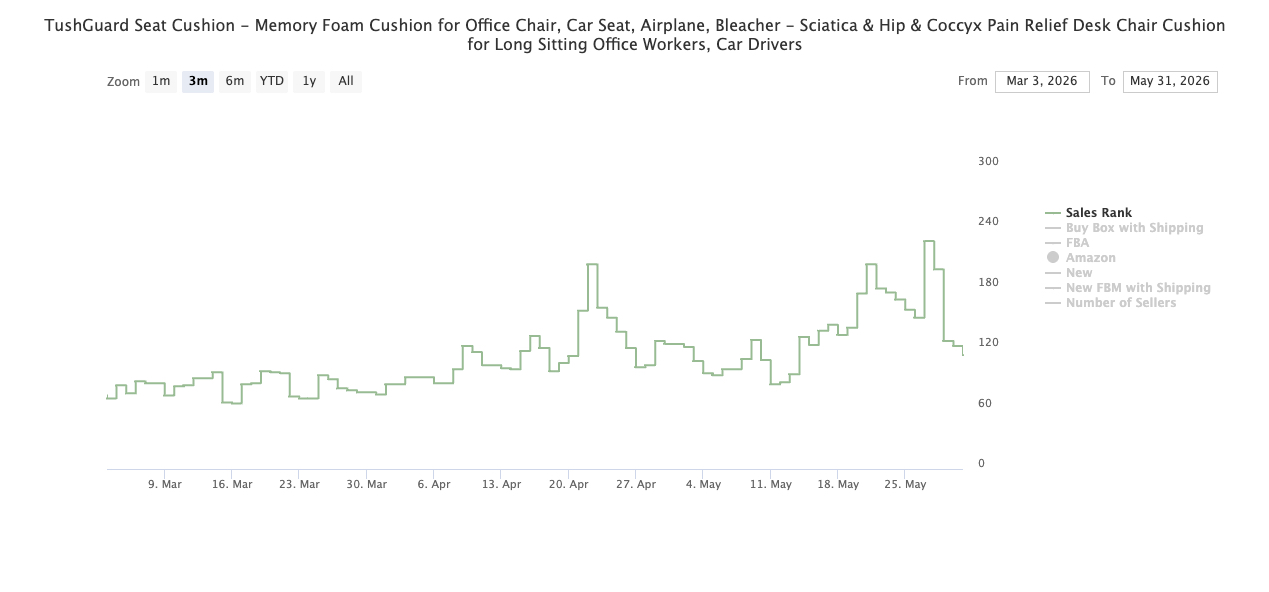
The rule of thumb: 90-day average BSR under 10,000 in a real category. Not a tiny niche subcategory where 10,000 is the whole pond. A real one. Home and Kitchen, Beauty, Sports and Outdoors, Pet Supplies. And the line should be flat or trending down.
Down means the rank is getting better. A line creeping up over 90 days means the product is losing relevance.
Snapshot BSR is what every tool shows because it's easy. Real BSR is what tells you whether the product actually moves.
Number 2: Active sellers, not total sellers
This is where most beginners lose money before they ever buy a unit.
Here's the trap with sellers count. You pull up a product, the tool says fifteen sellers, and the instinct is, great, manageable competition. Here's what nobody shows you. Of those fifteen sellers, eleven of them haven't moved a unit in three months. They're listings, not competitors. The two or three sellers who are actually moving inventory own this listing.
So when you check sellers, the real question is who's actually selling.
ProfitGuru shows both numbers stacked on the same panel. Total sellers, and below it, active sellers. If active sellers is one or two, you're walking into a duopoly. Even when total looks crowded.
Think about what that actually means. If fifteen sellers are listed but only two are moving units, you're not entering a crowded market. You're entering a market where two sellers already control the volume. They've optimized their listings. They've built reviews. Their FBA inventory is tight. You show up as the sixteenth listing and you're competing with two people who have a one-year head start.
It cuts the other way too. Sometimes total sellers is eight and active sellers is also eight. Every single one is moving units. That tells you demand is strong enough to feed eight sellers and there's still room. Demand spread across multiple active sellers is the distribution you want. Concentrated in two is not.
The rule: active sellers between three and eight is the sweet spot. One or two is a duopoly. More than ten and it's a price war.
The headline number, total sellers, is almost meaningless on its own. Always check active.
Number 3: Net margin after fees AND ad spend
This is the number most tools quietly lie about.
Not gross margin. Not the made-up figure a calculator spits out when you type in your cost. Real net margin. After fees. After ad spend. The actual dollars you take home per unit.
Here's how the math looks on a hero product. $20 sell price. The kind of product most beginners aim for.
- Sell price: $20.00
- Amazon referral fee (15%): -$3.00
- FBA fulfillment fee on a small standard item: -$4.00
- Cost of goods, landed from your supplier: -$5.00
- Shipping to the FBA warehouse: -$0.80
- Ad spend at launch (most beginners run 25% of revenue): -$5.00
Add it up. $17.80 in costs on a $20 product. That's $2.20 per unit. 11% net margin.
Most tools will tell you that product has a 30% or 35% margin and they're not technically lying. They just aren't counting ad spend.
Ad spend is the killer.
Now the part nobody talks about. That 11% is the launch margin. By month four or five, when reviews are built and organic rank is up, ad spend drops. 10 to 15% of revenue is normal once a product is established. Net margin suddenly climbs to about 20%.
That's the real game. You're not buying the launch margin. You're buying the month-six margin.
The rule: net margin at launch needs to be at least 8 to 10%. If it's negative or right at zero, the product cannot survive the launch period. And projected margin at month six should be 20% or higher.
Anything below that, you're working for Amazon, not for yourself.
What this looks like as a workflow
Here's how it actually runs in practice.
You see a product you're interested in. You open the listing. Check the 90-day BSR trend in the ProfitGuru Chrome Extension before scrolling any further. If it's above 10,000 in a real category, or the line is climbing, close the tab. The other two numbers don't matter yet.
If BSR clears, check active sellers on the same panel. If it's one, two, or eleven-plus, close the tab.
If both clear, open the FBA Calculator and run the margin math at both launch ad spend (25%) and month-six ad spend (12%). If either number is below the threshold, close the tab.
The whole thing takes about ninety seconds.
The point of the framework is not that it finds you winners. It disqualifies losers faster than anything else, so research time gets spent on the products that might actually work.
The honest part
Some sellers will say the three-number framework is too tight. They'll point to a product that fails one of the three checks and went on to print money anyway. They're not wrong. Edge cases exist.
But edge cases are not strategy. The framework exists to keep beginners out of the ninety percent of products where the math just doesn't work. With a five-figure starting budget, there's no room to learn the edge-case nuance on your own dollar.
Run the three checks. If a product fails any one of them, pass. There are millions of products on Amazon. The next one is right behind it.
The fastest way to see all three numbers on any Amazon listing is the ProfitGuru Chrome Extension. The 90-day BSR trend, the active vs total sellers gap, and projected net margin all show up overlaid on the listing page itself. No search needed. Try it on a product that's been on the shortlist. If any of the three numbers don't hit, that's a thousand-dollar mistake avoided.
Back to all posts